TFabGraph
"TFabGraph" is suitable for observing long time measurements by sensors in micro:bit.
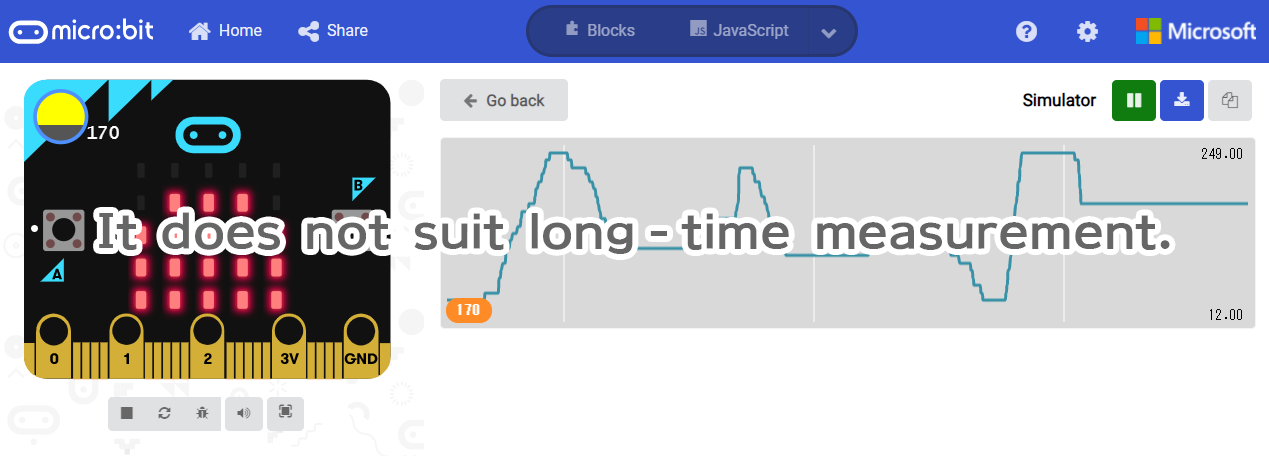
By using the console functionality in MakeCode, the sensor value can be easily graphed.
If you want to observe the following changes by the minute in class, you need to stop the measurement once, download the data and graph it in Excel or a spreadsheet.
- Movement of the sun (changes in brightness)
- Changes in atmospheric pressure, temperature and humidity
- Changes in water temperature
- Changes in soil temperature
- Movement of animals
- Traffic volume of people
- Changes in water level
- Changes in noise
This method is not suitable for long-time measurement.
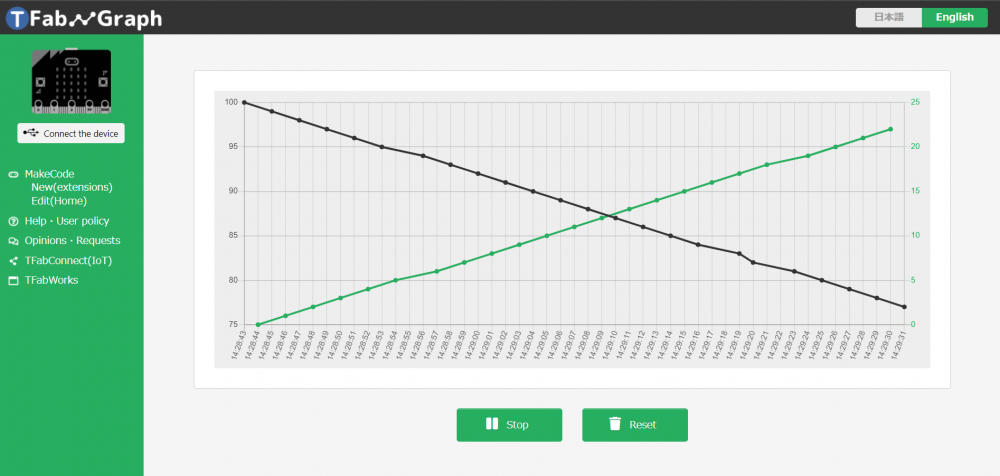
TFabGraph is a free graphing tool to solve this problem. You can visualize sensor measurement in real time from start to current. No software installation is required, and you can easily use it with a browser. Since it supports 2-axis graphs, the values of 2 sensors can be graphed at the same time.
How to use
Introduce the case to graph values of temperature and light level sensors in micro:bit.
Make a program
- Connect the micro:bit and PC through USB cable.
- Go to TFabGraph (https://graph.tfabworks.com/) in your Chrome browser.
- Click "New (Extension)" in the menu on the left side. Then click "Edit Code" at the top.
- Click "Pair device" to connect micro:bit and MakeCode.
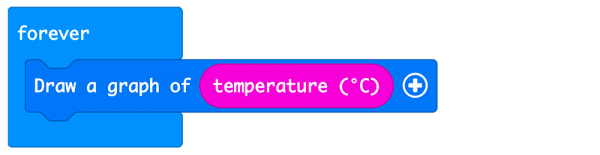
- Make a program with blocks. "Draw a graph" block is in the menu "TFabTools".
Click the + icon on the right to display a pull-down menu that selects "main axis" and "2nd axis".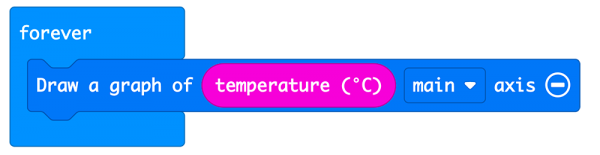
By setting the block that draws the light level graph as the 2nd axis, you can draw the temperature and light level graphs at the same time.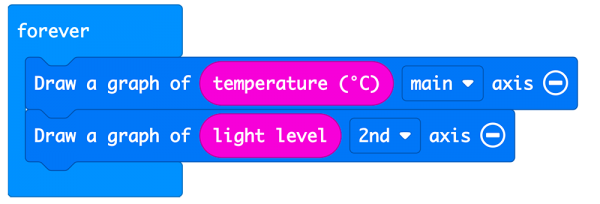
- Click the download button.
Draw a graph
- Close MakeCode and return to the TFabGraph screen.
- Click "Connect the device" in the menu on the left side to connect the micro: bit and TFabGraph. If it does not work, try plugging/unplugging the USB cable and reloading the page.
Then, the graph will be drawn automatically.
Usage example in class
- 3rd grade science "The sun and the ground"
- 4th grade science "Metal, water, air and temperature"
- 5th grade science "Weather conditions"
- 5th grade home economics "Comfortable housing"
- 6th grade science "Natural disaster"
- 7th grade technology and home economics "Automatic measurements and controls"
Operating conditions
Chrome browser (except for mobile)
Related Services
Please try "TFabConnect", an IoT service that you can check graphs remotely, overlay multiple graphs, and operate micro:bit from a distance.